Job Listings
Track the number of job listings each day to better understand the hiring plans of an individual company. This data set can be filtered by location, position, and industry. Certain positions and locations can be indicators of internal activity such as who the company is hiring as well as how quickly a company is expanding into a new market. Users will be able to see the overall number of job listings over time for a company giving insight into growth. Job listings is one of the drivers of turnover, since it takes more resources to hire than fire employees.
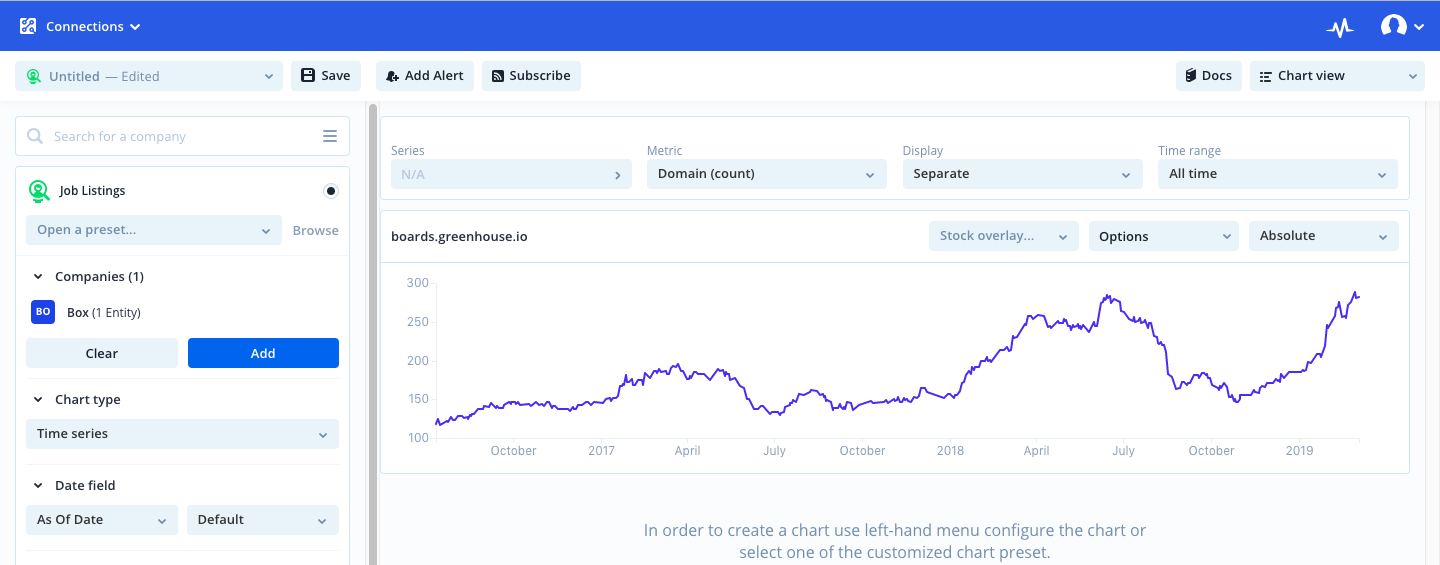
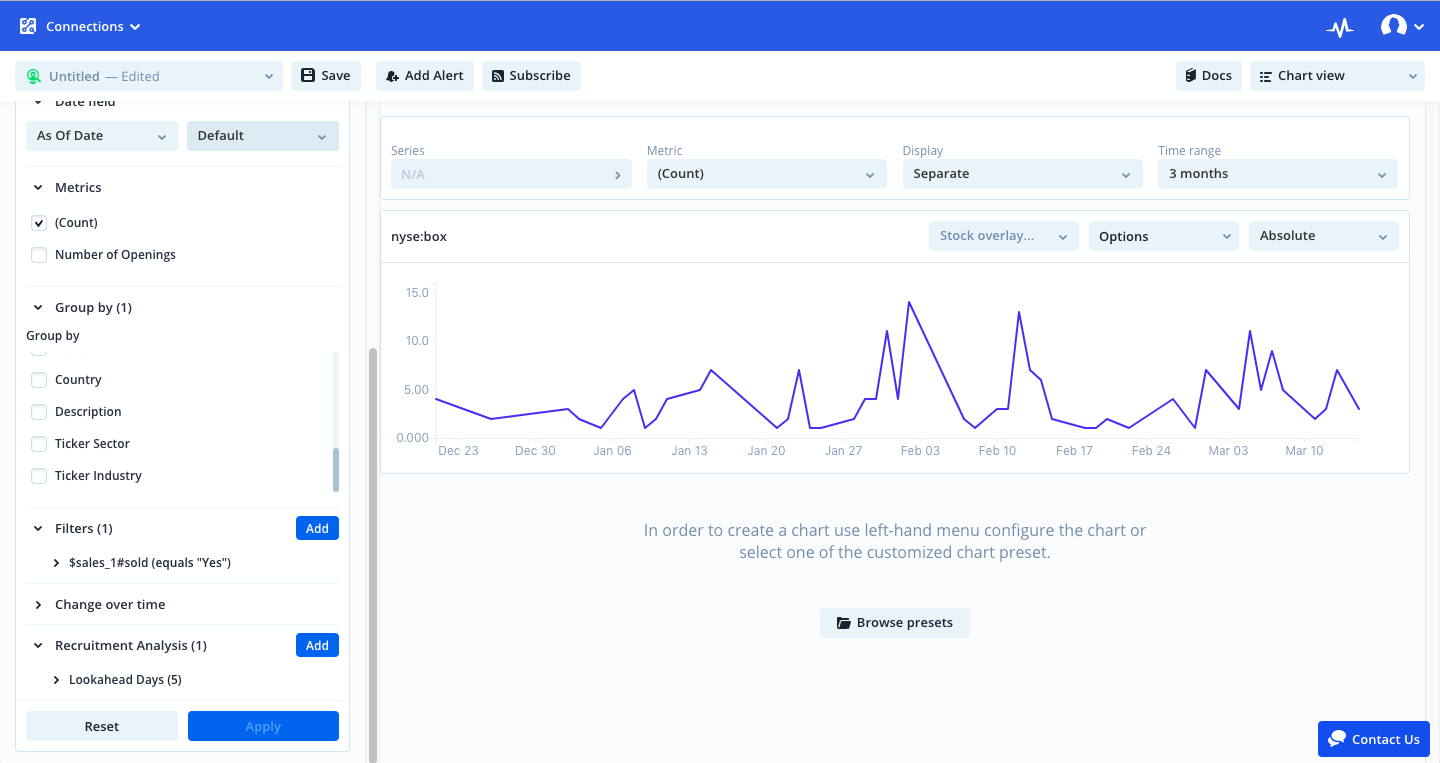
Here's an example showing the number of open job listings at Box over time:
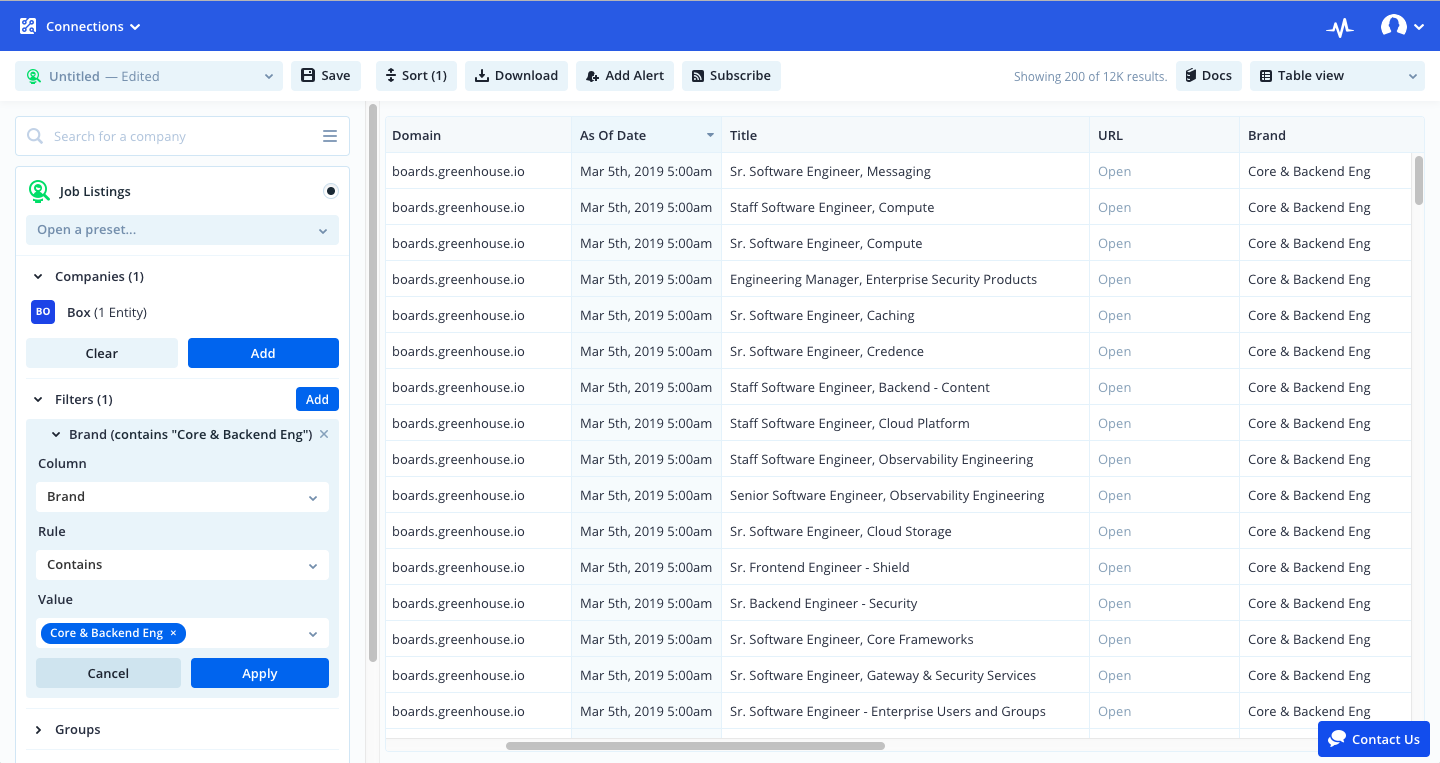
Create keyword searches by using the filters tab. Below is an example of a keyword search for "Core & Backend Eng" within the Brand column.
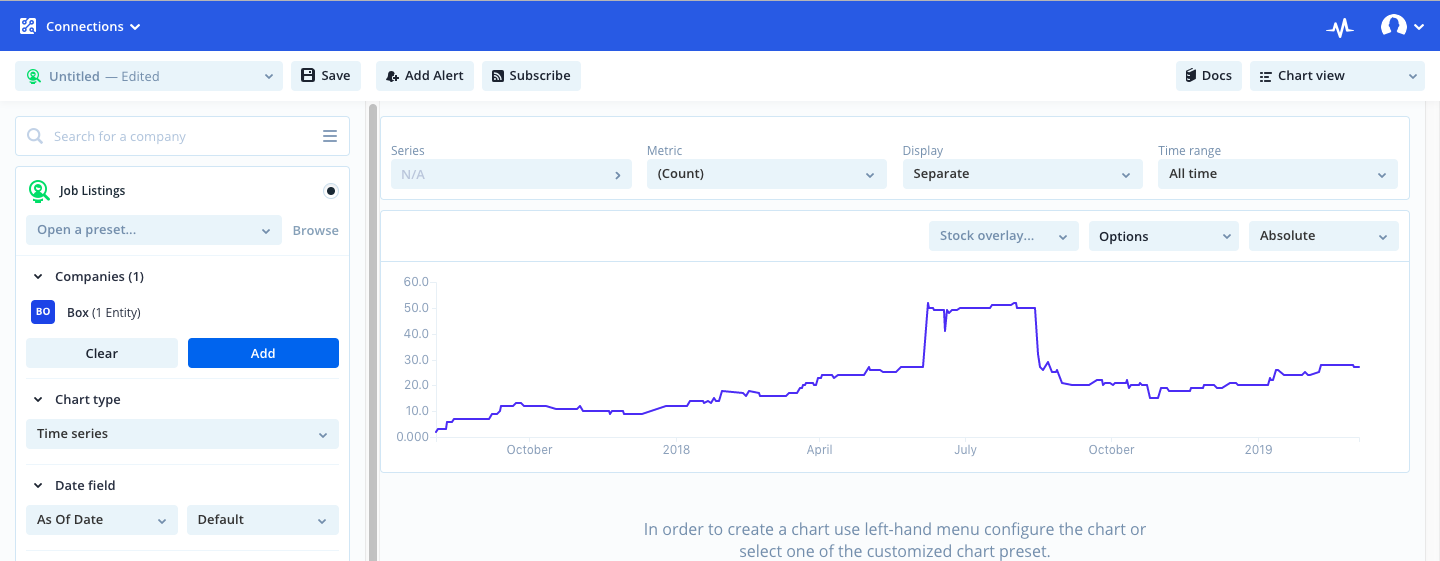
Switch to Chart view and click custom chart to view the custom time series.
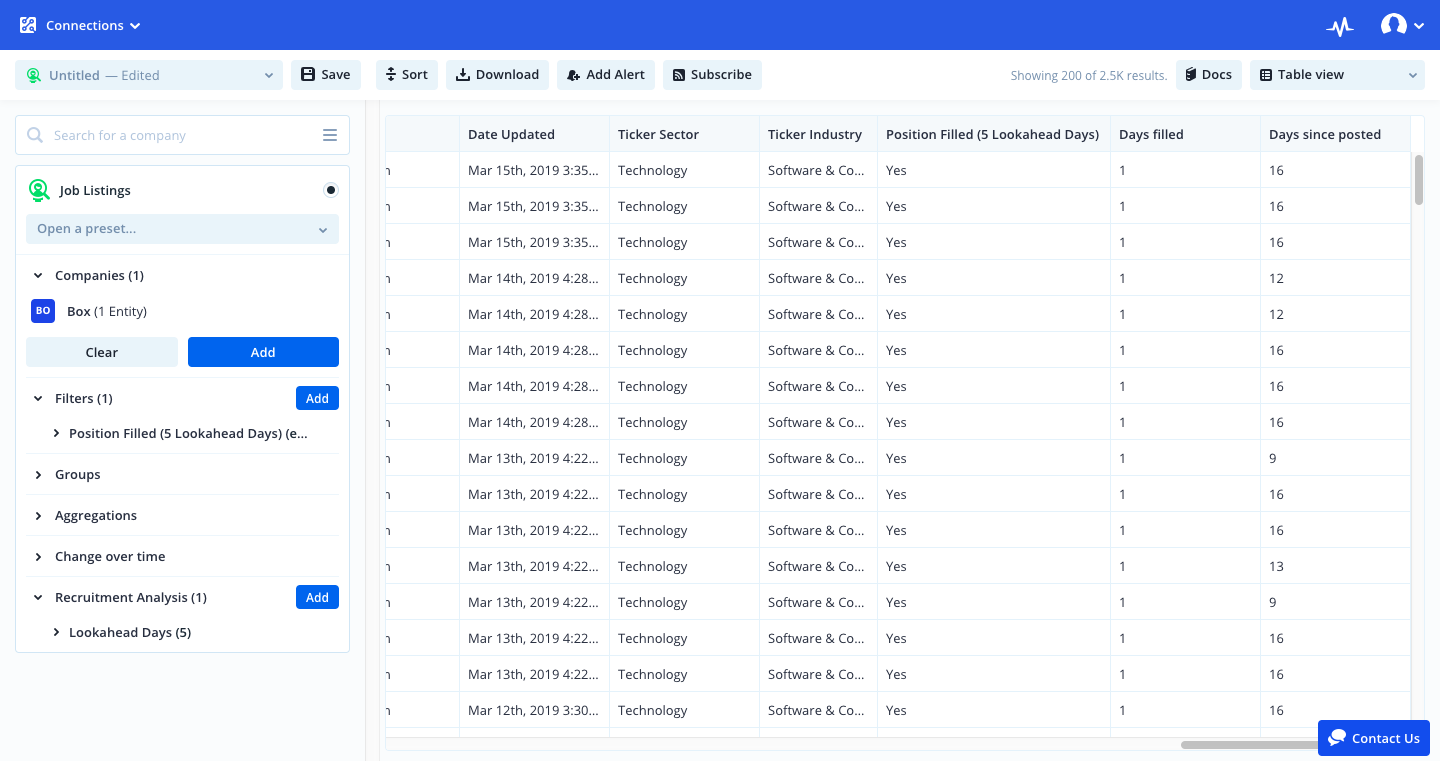
For any job listings dataset, you can use the recruitment analyzer to see which individual jobs have been filled. The number of "Lookahead Days" represents the number of days in the future that will be checked to see if the same job returns to the target website.
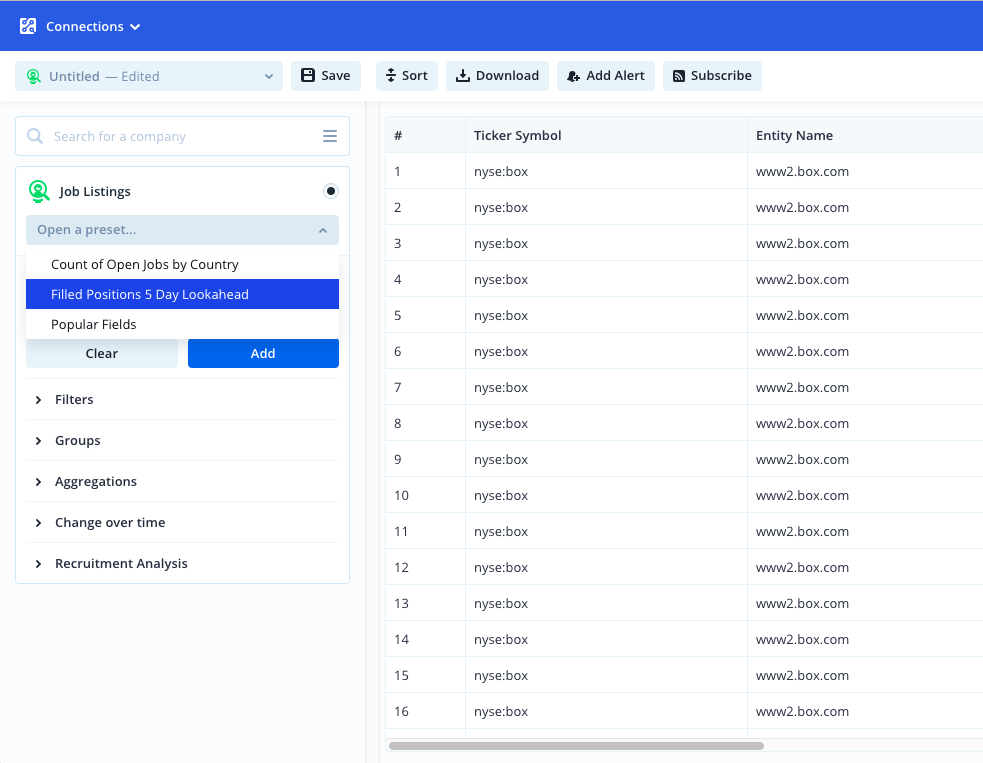
Let's use Box job listings as an example:
Simply use the preset tab and choose accordingly. This preset will use a standard of 5 Lookahead Days. Users will be able to cutomize this number to their liking.
Three new columns will be populated, Positon Filled, Days Filled and Days since posted.
To view the time series click Chart view followed by custom chart.
Here is the link for the documentation on the columns for this dataset:Columns Definition