Anomaly Detection
The Anomaly Detection feature flags data points that are more than one standard deviation away from the dataset's moving average. Identifying these outliers in your data can help find insights, opportunities, or errors.
Read moreArticles related to our features and datasets.
The Anomaly Detection feature flags data points that are more than one standard deviation away from the dataset's moving average. Identifying these outliers in your data can help find insights, opportunities, or errors.
Read moreThinknum's "Car Inventory" dataset tracks the inventory of all major online dealerships. Since each vehicle has a unique identification number, users are able to see when a vehicle is added or removed from a dealerships inventory. Tracking the number of vehicles leaving inventory allows users to predict sales figures.
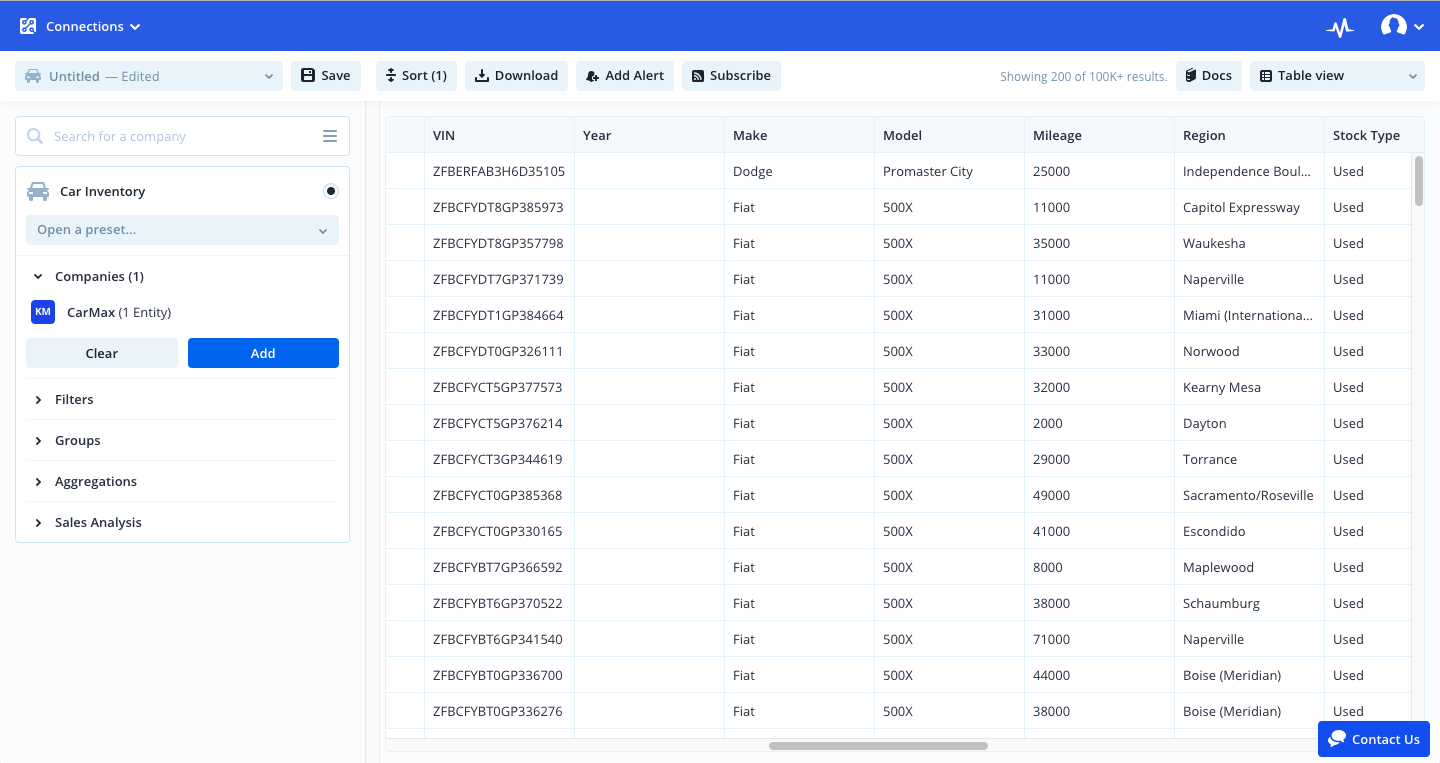
Utilize the Sales Analysis tool to see which cars have been sold. The number of "Lookahead Days" represents the number of days in the future that will be checked to see if the same VIN returns to the dealer's inventory.
Let's take CarMax as an example. Simply
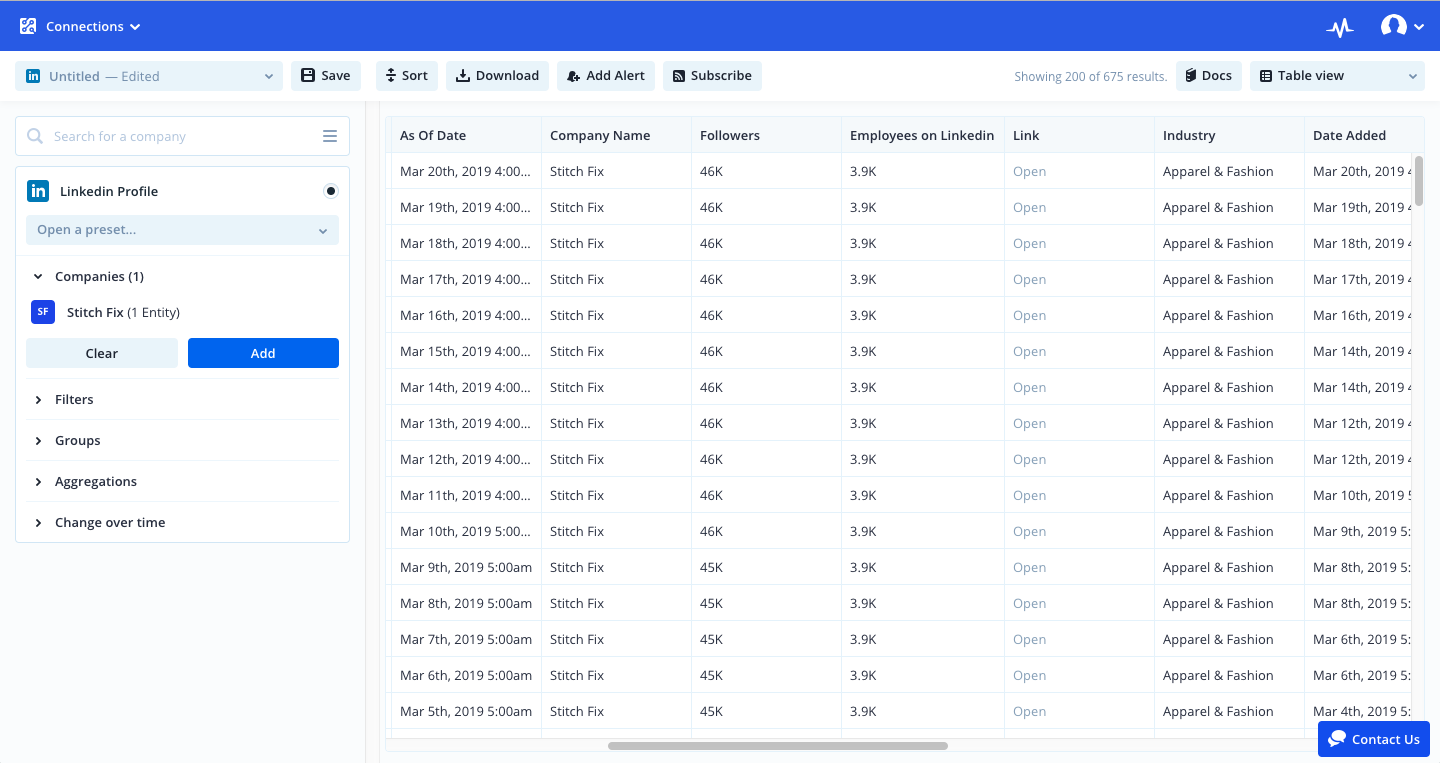
Read moreThinknum's "LinkedIn Profile" dataset tracks the aggregated number of profiles which list a company as their employer. As a proxy to measure employee headcount, users will be able to see whether as company is gaining or losing employees over time.
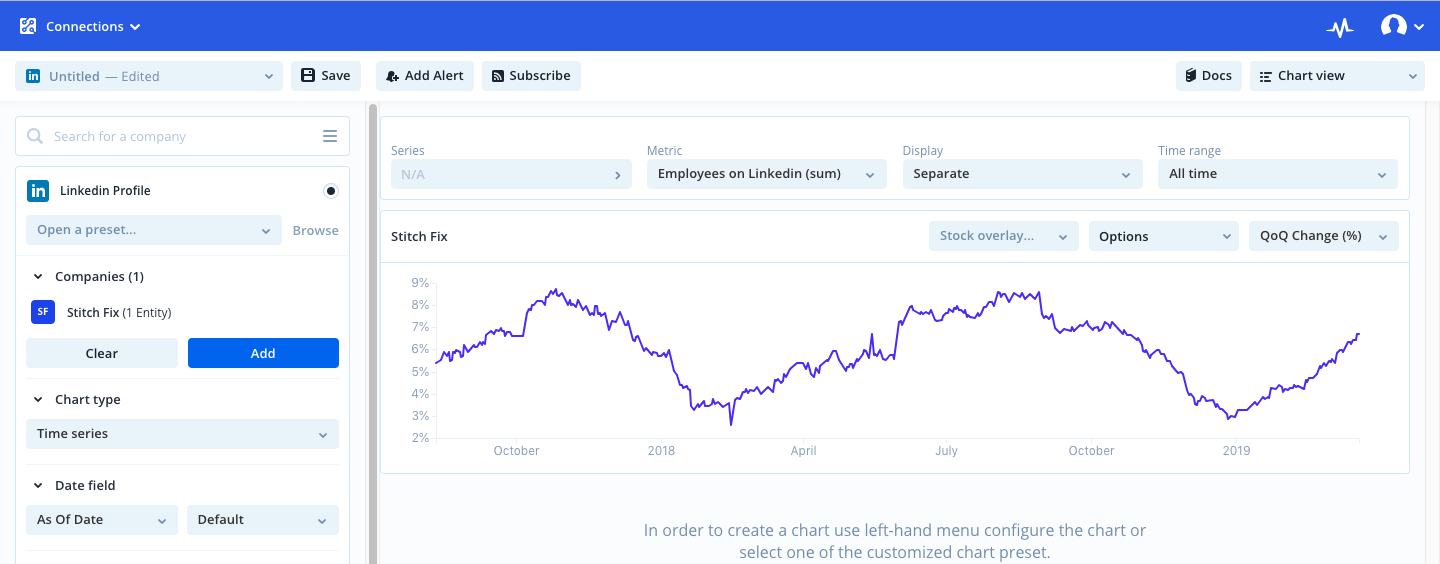
Taking Stitch Fix as an example, users will be able to see the number of followers as well as employee count.
Switch to Chart view and utilize the "Absolute" tab to view DoD, QoQ and YoY percent change.
Here is the link for the documentation on the columns for this dataset: Columns Definition
Read moreTrack the number of job listings each day to better understand the hiring plans of an individual company. This data set can be filtered by location, position, and industry. Certain positions and locations can be indicators of internal activity such as who the company is hiring as well as how quickly a company is expanding into a new market. Users will be able to see the overall number of job listings over time for a company giving insight into growth. Job listings is one of the drivers of turnover, since it takes more resources to hire than fire employees.
Here's
Read moreThinknum’s “Stores” dataset allows users to overlay and calculate proximity and density of competitor overlap of store locations between thousands of public and private companies. Our demographic mapping tool enables profiling of store locations based on US Census and BLS demographic metrics. Store locations are indexed from the company’s own website. This dataset is comprised of whitespace, a function that will enable users to see new innovative opportunities.
Utilize the nearby competitor function to analyze the number of competitors that exist within a user defined radius of a particular store.
Let's take Lululemon stores as
Read moreAs economic activity comes online, new data trails are left behind. The most innovative corporations and investors are using this data to get ahead.