Alternative Data in United Kingdom: Insights and Use Cases
Alternative Data Applications: A Guide for UK Investors
As economic activity comes online, new data trails are left behind. The most innovative investors leverage this data for alpha-generating insights. The following use cases illustrate how Thinknum’s alternative datasets power investment decisions across UK companies.
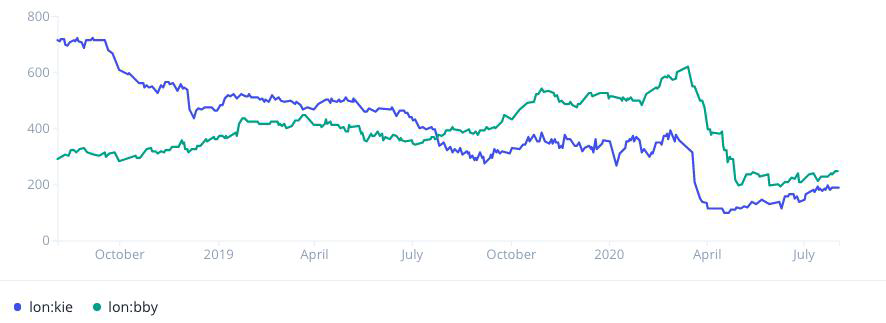
Construction: Compare Hirings Over Time
Changes in a company’s demand for new hires is a valuable leading indicator for future corporate performance. Savvy investors look to job postings to predict a company’s performance. View the number of open positions at Balfour Beatty and Kier, for example. Then filter to gain in-depth competitive insights into specific market, location, and job categories.
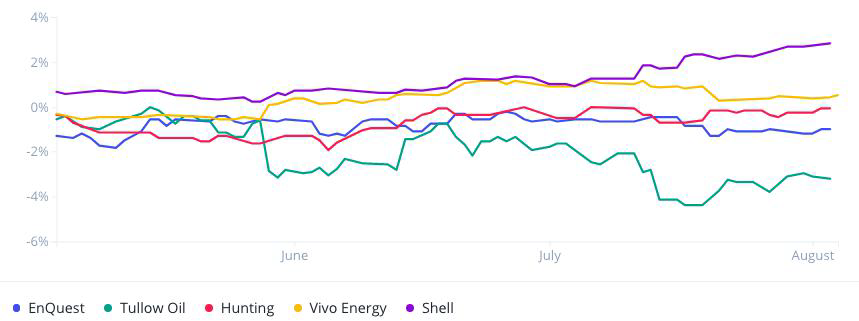
Energy: Headcount Growth via LinkedIn Profile
Use the aggregated number of LinkedIn profiles that list a company as their employer as a proxy for realtime employee headcount relative to a company’s peers. Track corporate expansion and also layoffs in real time.
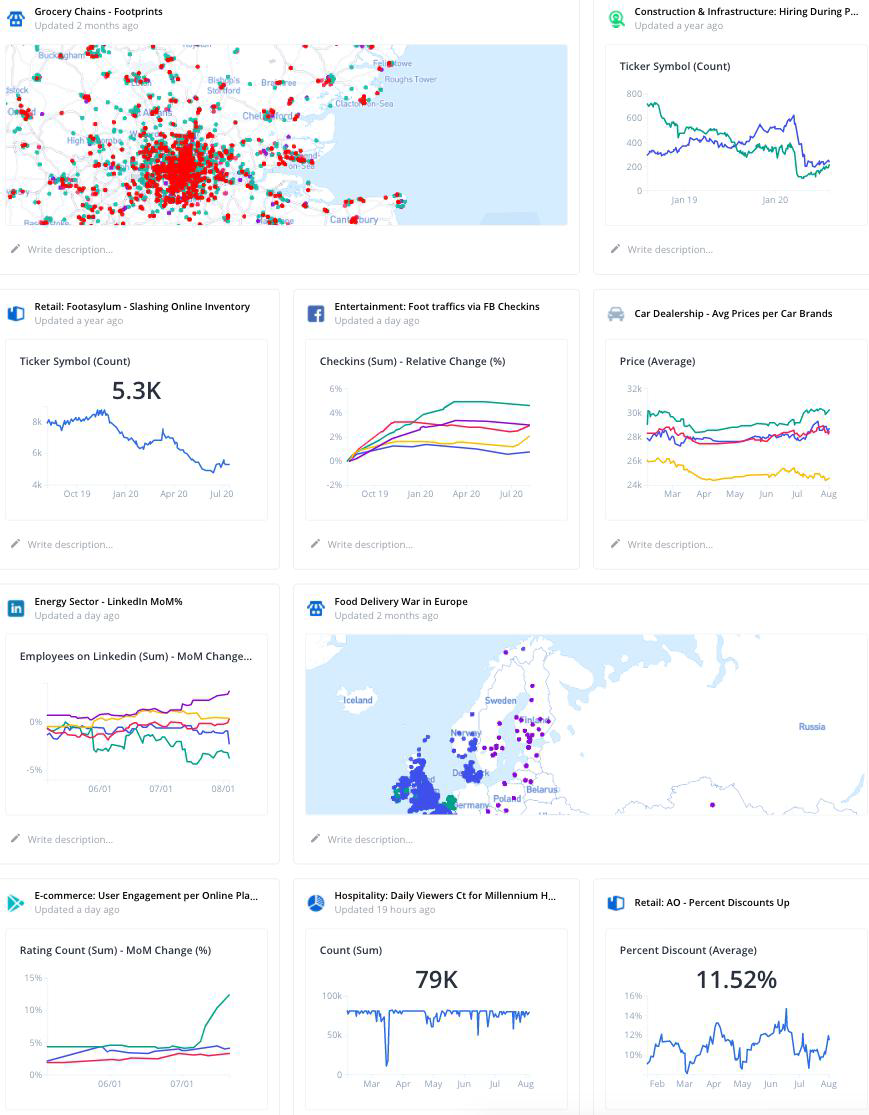
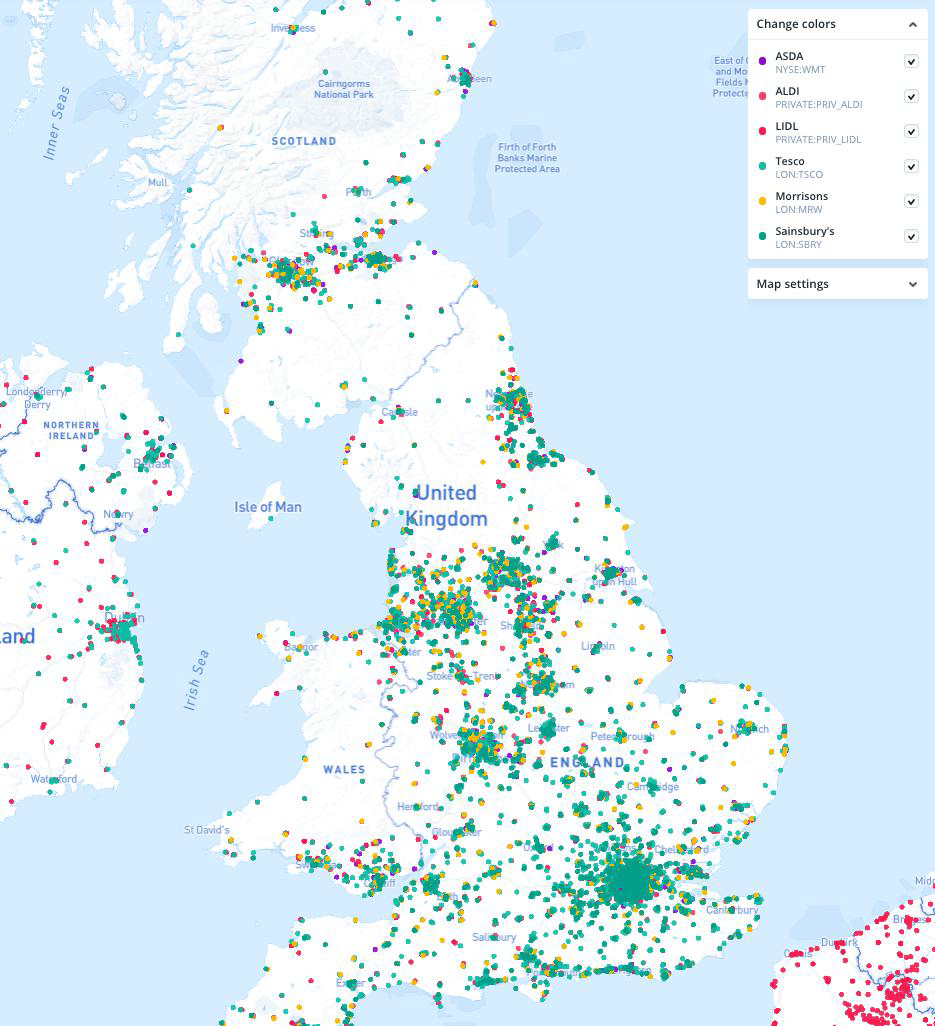
Consumer: Footprints of Major Grocery Chains
Display thousands of competing grocery chain store locations across the UK in a user-friendly map. Store locations are indexed from the company’s own website. Zoom in to take a closer look at regional competition. Calculate proximity and density of competitor overlap in bricks-and-mortar locations.
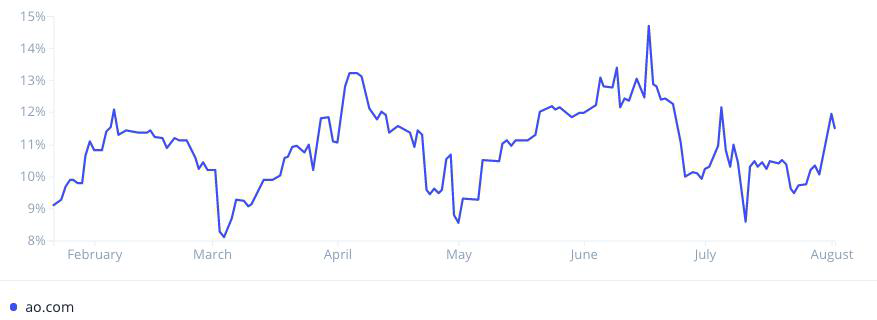
Retail: Track Pricing Trends
View and compare retailers’ discount trends. Track changes in the number of discounted items, as well as the percentage discount daily. Use retailer-listed products and discount prices to derive trends in companies’ pricing strategies. This dataset can also be used to understand the effects of cyclical and/or one-off events, like the COVID-19 pandemic, on retailers.
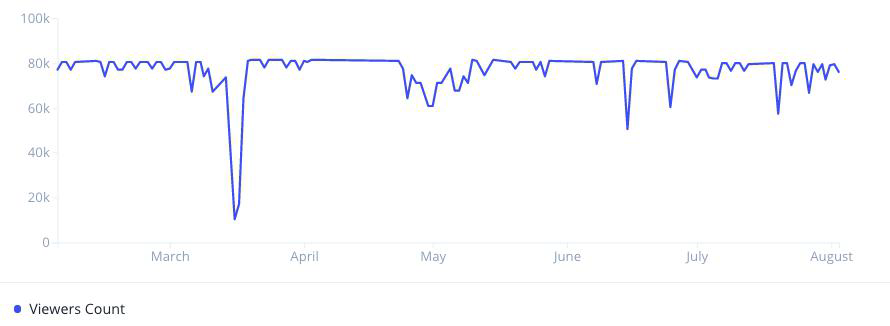
Hospitality: Track User Traffic to Hotel Websites
Track unique visitors and their engagement to company websites. Leverage this real-time web traffic data to understand companies’ traction and performance under specific circumstances. For example, trends in the number of daily viewers indicates the impact of the COVID-19 pandemic on Millennium Hotels and Resorts
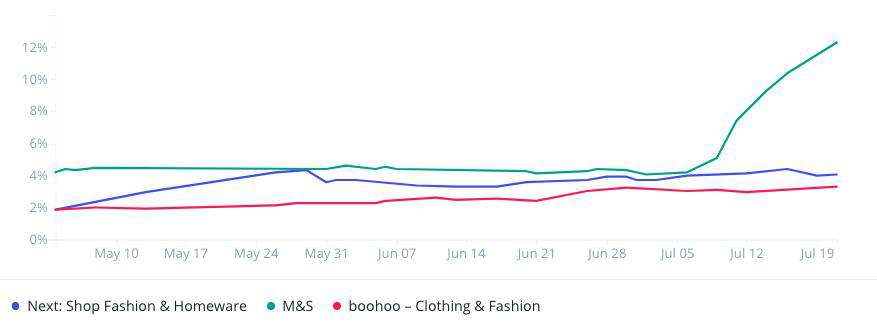
E-Commerce: User Engagement Online
As businesses go mobile, analyze real-time user engagement data from mobile apps and social media for an edge on specific companies. Examples include:
• changes in number of Instagram followers
• changes in number of Twitter followers
• Number of user reviews and ratings
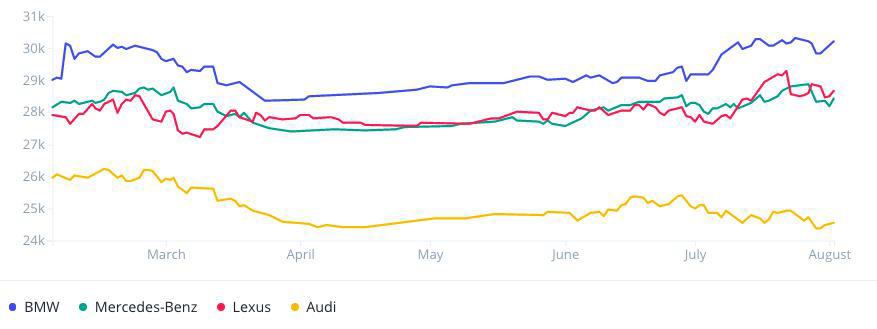
Auto: Sales by Car Brand
The car inventory dataset tracks the daily inventories of all major online dealerships. Since each vehicle has a unique identification number, users are able to see when a vehicle is added or removed from a dealership’s inventory as a proxy for which cars are sold. Users can filter by brand, year, car model, location and other attributes.
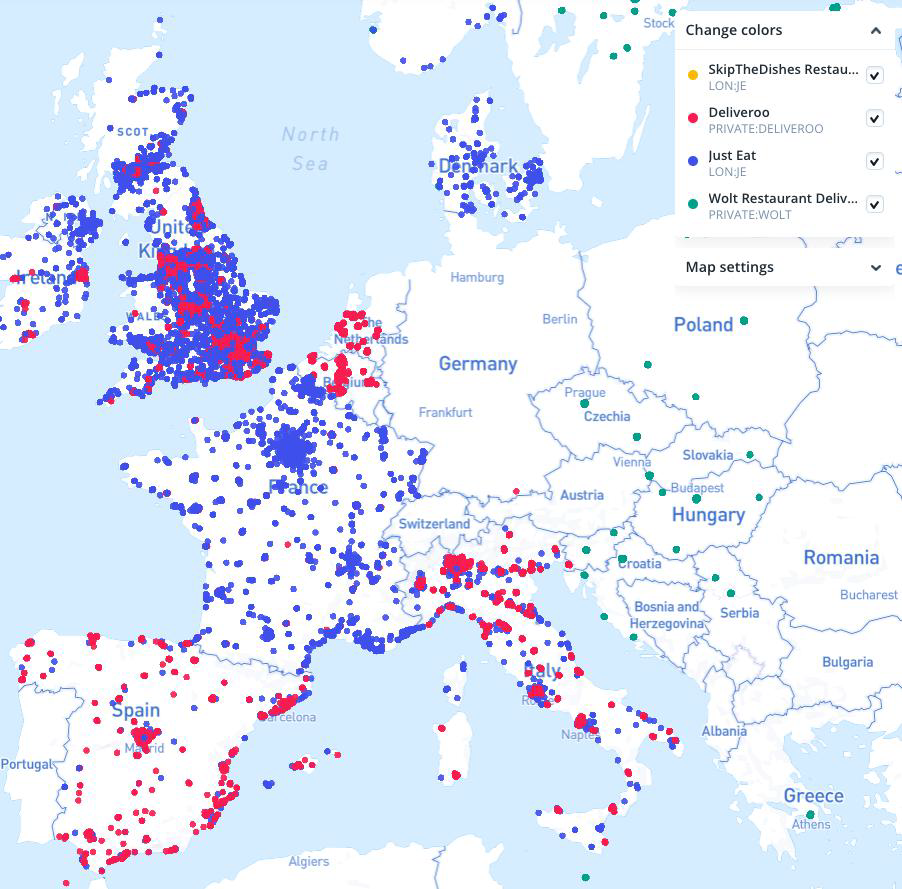
Consumer: Food Delivery Wars in Europe
As the food delivery wars heat up across Europe, map the restaurants that partner with each player to understand where competitors are fighting for market dominance. Display thousands of restaurant locations across the UK in a user-friendly map.
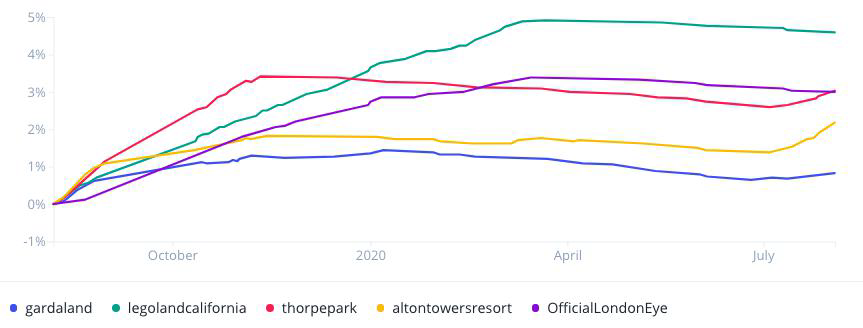
Entertainment: Foot Traffic via Facebook Checkins
Investors glean visitor insights from foot traffic data. Facebook Places provides such an anonymized metric for measuring traffic flows over time. This can be used to measure which businesses are hit hardest by the COVID-19 pandemic in real time.
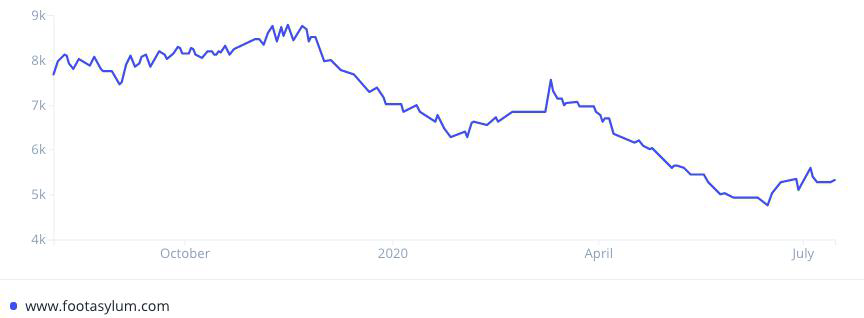
E-Commerce: Footwear Online Inventory
View the number of products listed by eCommerce platforms over time. Use this dataset as a proxy for movements in platforms’ online inventory. This dataset can also be used to understand the effect of cyclical and/or one-off events, like the COVID-19 pandemic, on vendors.