Generate Alpha in Australia
Alternative Data for Australian Companies: Insights and Use Cases
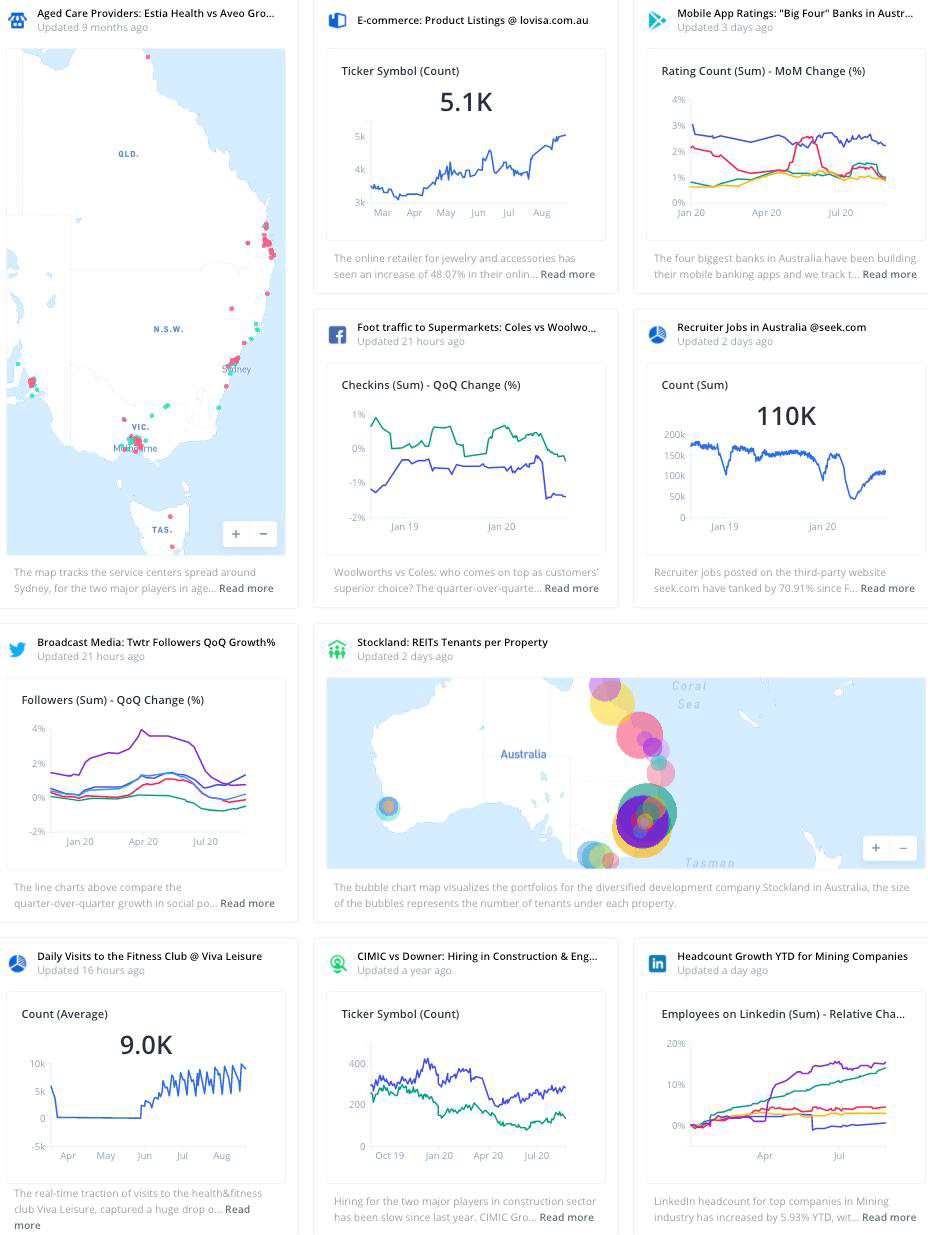
As economic activity comes online, new data trails are left behind. The most innovative investors leverage this data for alpha-generating insights. The following use cases illustrate how Thinknum’s alternative datasets power investment decisions across Australian companies.
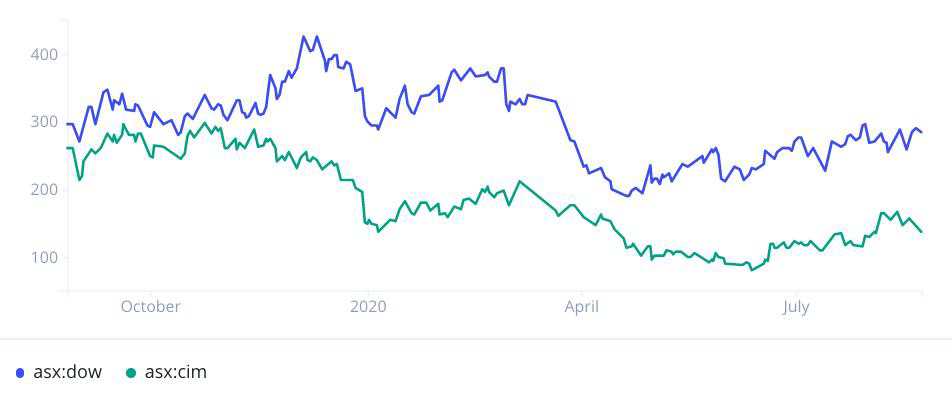
Construction: Compare Hiring Over Time
Savvy investors look to hiring data as a valuable leading indicator of future corporate performance. View the number of open job listings at CIMIC Group and Downer, for example. Filter to gain in-depth competitive insights into specific market, location, and job categories.
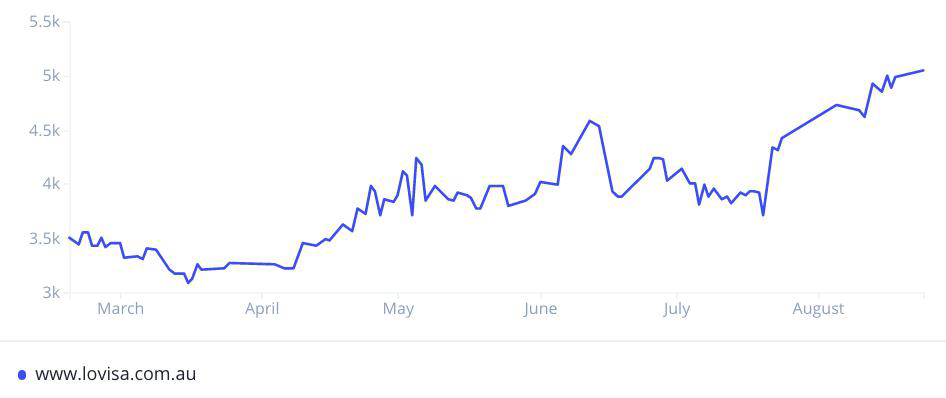
E-Commerce: Analyze Product Pricing
View the number of products listed by eCommerce platforms over time. Use this dataset as a proxy for movements in inventory. Understand the effect of cyclical and/or one-off events, like the COVID-19 pandemic.
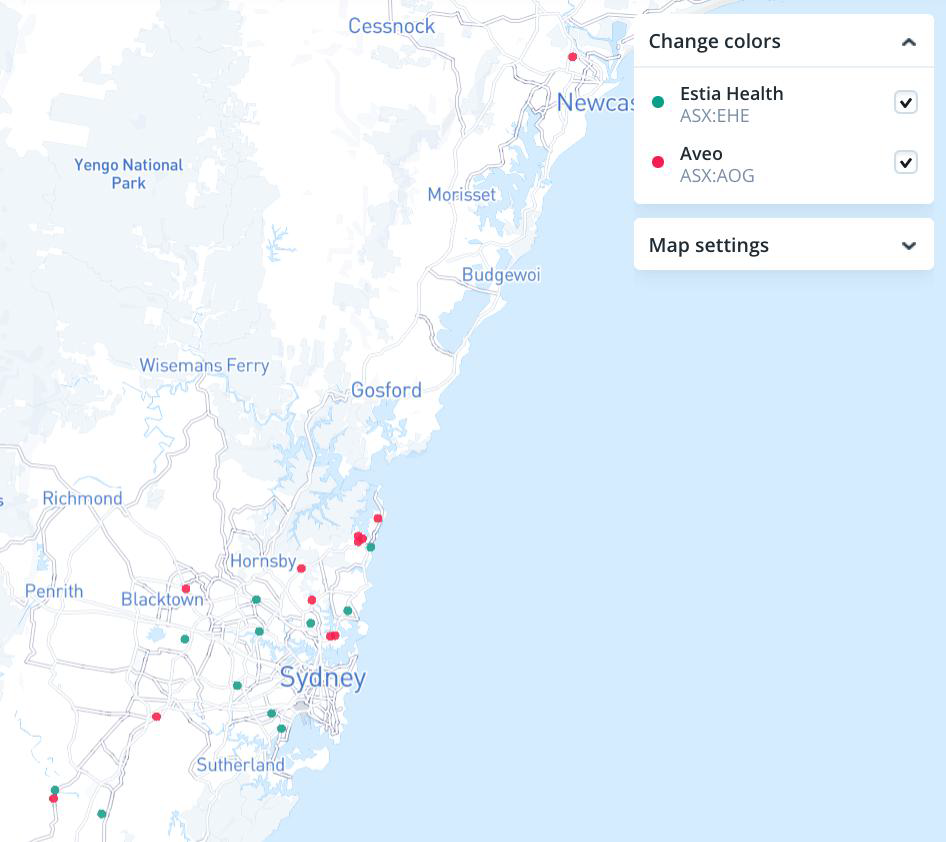
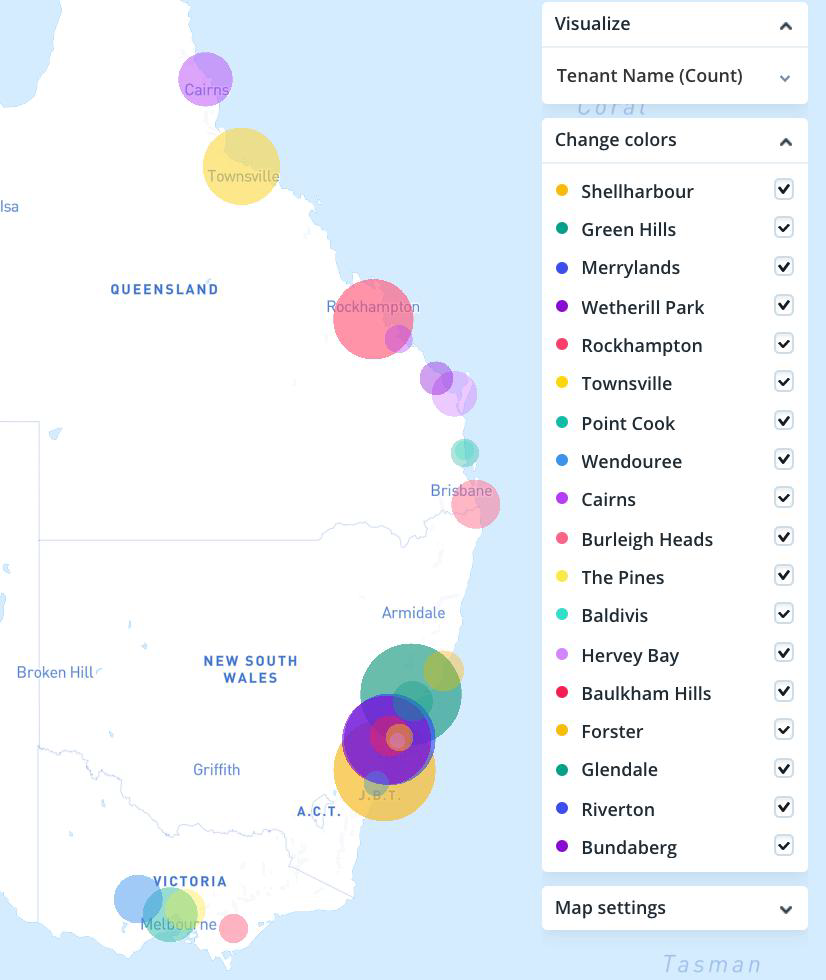
Healthcare: Interpret Aged Care Home Locations
Display competing aged care homes across Australia in a user-friendly map. Locations are indexed from the companies’ own websites. Zoom in to take a closer look at proximity of competitor overlap.
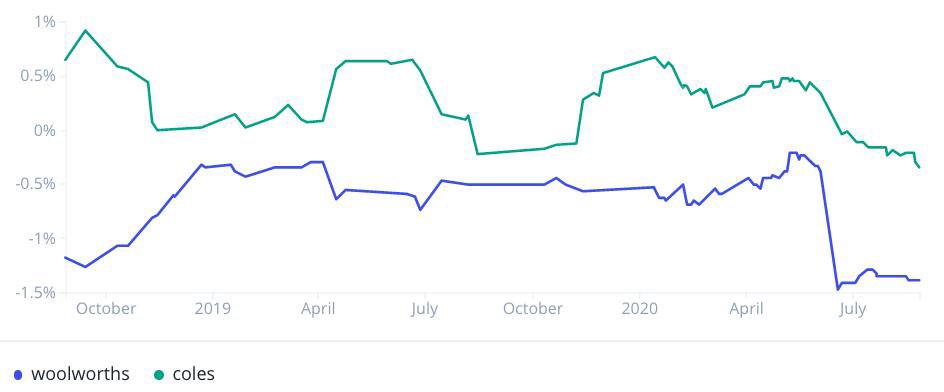
Foot Traffic: Compare Leaders of Australian Supermarkets
Investors leverage anonymized foot traffic data, gathered from Facebook Places, to glean insights from foot traffic over time. This can be used to measure which businesses are hit hardest by the COVID-19 pandemic in real time.
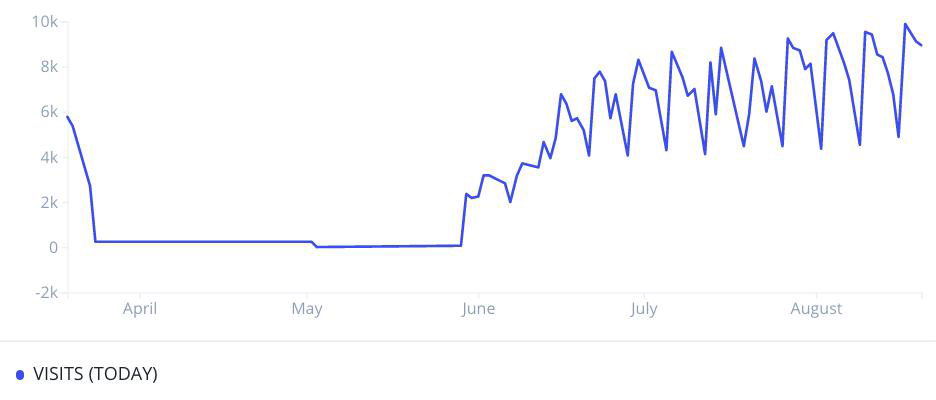
Recreation: Trace Visits to Gym stores
Visitor numbers to Viva Leisure fitness club locations are updated in real-time on their corporate website, giving investors a leading indicator of the company’s number of visitors in real time.
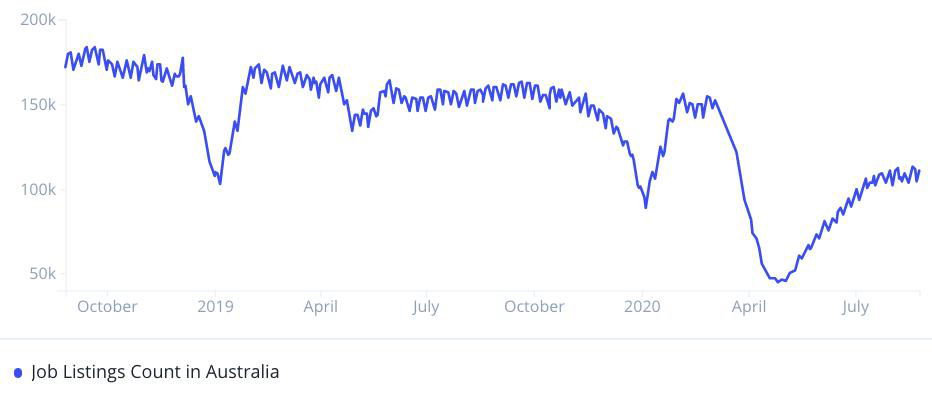
Traction: Predict the success of Job-matching Platforms
Track the number of recruiter jobs on jobseeker website seek.com, analyzing pandemic-related fluctuations in job openings.
REIT Tenants: Analyze Commercial Real Estate
Track the tenant directories of mall REITs on a daily basis. Identify the total number of tenants for a REIT over time, or a speiciREIT’s exposure to specific tenants. Drill down to find the square footage of each individual tenant for a given REIT, or analyze aggregate vacancy rates across an entire REIT.
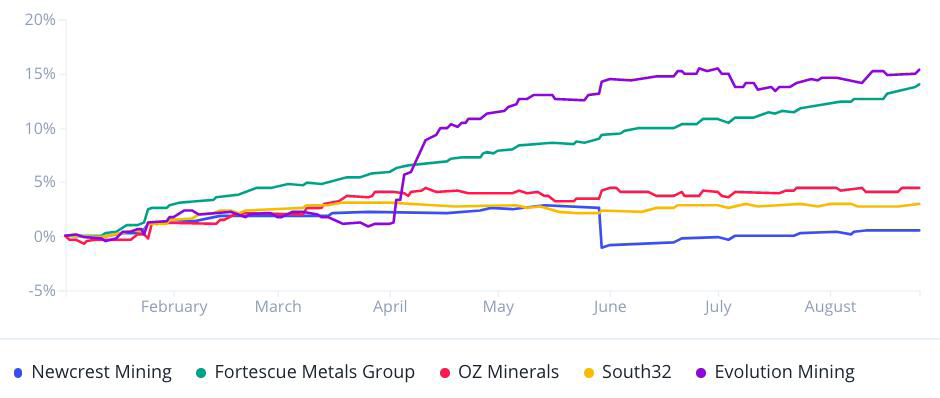
Mining: Evaluate LinkedIn Headcount
To proxy for employee headcount, use the aggregated number of LinkedIn profiles that list a company as their employer. Compare competitors’ headcount or track corporate expansion and layoffs.
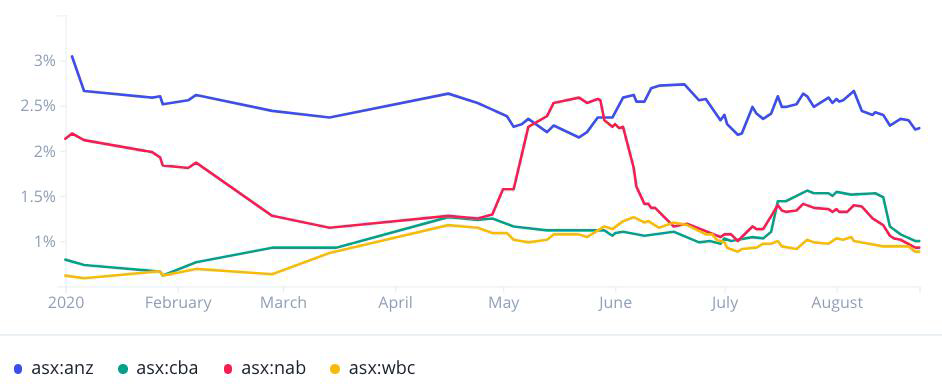
Banking: Track App ratings for the “Big Four”
As businesses go mobile, analyze real-time user engagement data from mobile apps and social media. Rank competitors on their number of app reviews and ratings.
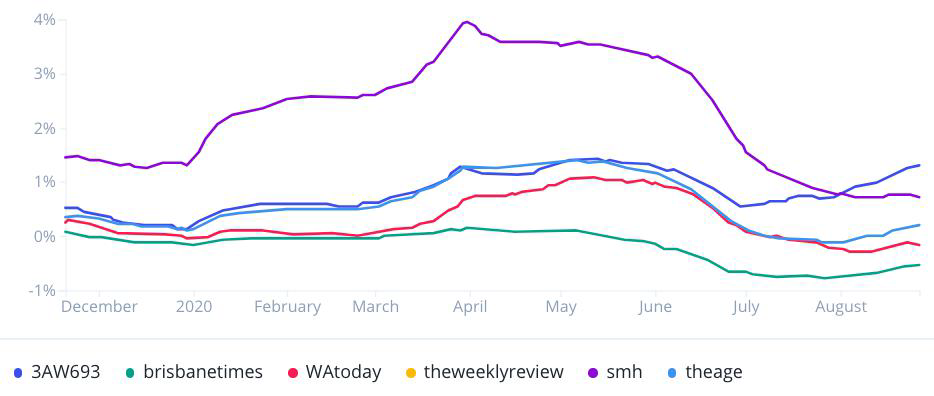
Social Media: Analyze Twitter Followers
Track social media engagement data to see what companies have an edge in marketing and communicating with their users.