The War for Talent in the Tech Industry:A Workforce Demand Data Case Study
Authors:
Stephen Weltz, Workforce Analytics Manager, Human Capital Management Institute
Jeff Higgins, Founder & CEO, Human Capital Management Institute
1. INTRODUCTION
The pandemic has forever changed the war for talent. The foundations of the economy were shaken, and many companies, initially, had to respond with workforce reductions, furloughs, and hiring freezes. Now, however, we are seeing a surge in job openings that are not being filled, with the Washington Post stating “there are 10 million job openings, yet more than 8.4 million unemployed are still actively looking for work”. Employees are reevaluating work and priorities, and companies are trying to meet the challenges of this new competitive environment.1
These challenges are further complicated by differing industries , job types, needed skills, and location. For tech talent in India, for example, the market is particularly booming. Tech companies, multinational corporations, and start ups are battling for top talent, and employees with the right skills are at a premium.2
How can companies better navigate the resulting wars for talent that such conditions create? By better utilizing both internal and external data on the workforce. Using internal data, companies can assess their workforce productivity, their leadership effectiveness, and their quality of hiring. With the combination of internal and external data, companies can benchmark their performance and pay rates against competitors, and elevate their workforce strategy through workforce planning.
In this report, we take a look at job demand data from Thinknum’s “Job Listings” database through HCMI’s Job Analysis Framework to assess the current landscape for talent competition within the tech industry. This can provide context for companies seeking tech talent, as well as preview the depth of analysis that such data can provide.
Key Questions that can be addressed by competitive labor data ( and relevant sections):
- How much are our competitors hiring? Where? (SECTION 2)
- Where is the best location to hire, expand, or relocate? (SECTIONS 3 & 4)
- What job roles are in highest demand? (SECTION 4)
- Will your current labor market meet your expected demand? (SECTION 4)
- What talent supply will be available? (SECTION 4)
- Which critical job roles will be hardest to fill? ( SECTION 4)
DATA SAMPLE
Thinknum’s Job listings database contains job postings from 10,460 of the top companies across the globe for the last 6 years including facets such as job title, location, and description. For this study, 41 of the top tech companies were chosen for a job demand analysis of the industry. Data was pulled between October 1st and 17th 2021.
Data was analyzed from 2016-2021 by quarter, though the analyses presented here focus primarily on 2021. Unique job listings were each counted once per quarter in which they remained posted. Job listing data spans 138 unique countries, though the majority, and therefore the focus of this paper, come from the United States followed by India. Listings in the United States are further segmented by State.
Job title and location data was standardized to optimize analyses, though for a significant number of job postings location data was not available (18%), or not included in the posting itself. These job listings are included in analyses where location is irrelevant, but excluded otherwise.
2. WHAT ARE TECH COMPANIES HIRING?
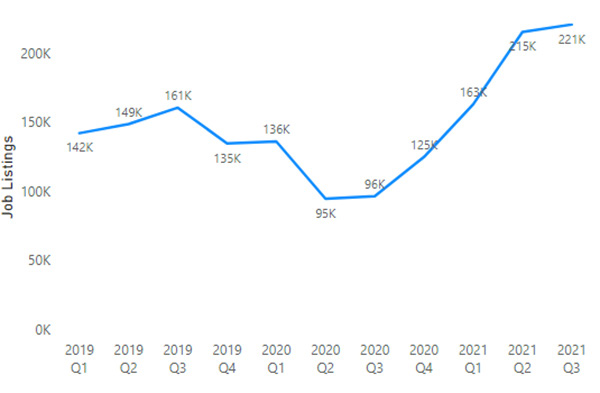
Figure 1.Total Job Listings Trend
Globally, tech company hiring is higher than it has ever been, with the previous peak being Q3 of 2019, followed by an expected drop as COVID hit. The lowest point was Q2 and Q3 of 2020 with 94663 and 96586 postings, respectively. After which, hiring inc reased each quarter by a CAGR of 31% until 215442 in Q2 2021. In Q3 listings remained at a similar level, increasing slightly to 220850.
3. WHERE ARE TECH COMPANIES HIRING?
In the United States, this mid 2021 spike is a return to pre-COVID form, as the highest number of listings is actually found in Q3 of 2019, after which job listings were reduced by nearly 50%. Worldwide, excluding the US and India, hiring followed a similar pattern, with a 2019 Q3 peak, followed by a heavy decline and increase to new heights in 2021. India, on the other hand, is seeing a boom in tech job listings more than double anything seen before 2021. Based on the increases in hirings internationally, particularly in India, the actual % of job listings from tech companies based in the United States has decreased from 50% in Q1 2019 to a record low 39% in Q3 2021. India, on the other hand, has increased from 10% to 22% in the same span of time.
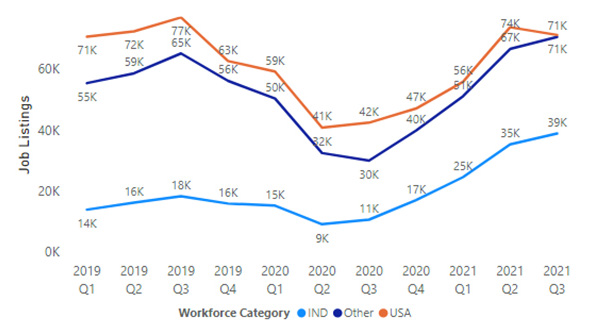
Figure 2. Job Listings Trend by Country
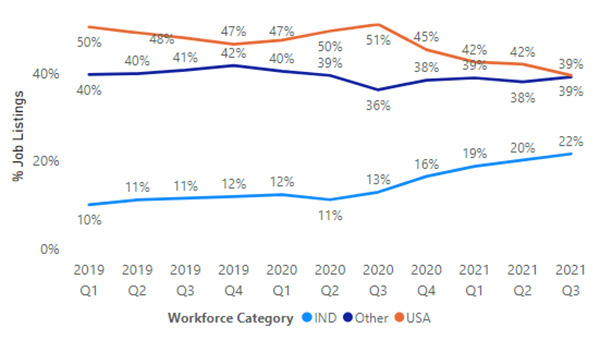
Figure 3. Job Listings Percent Trend4
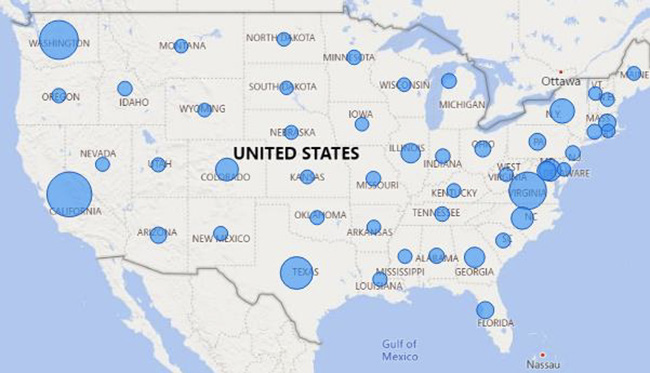
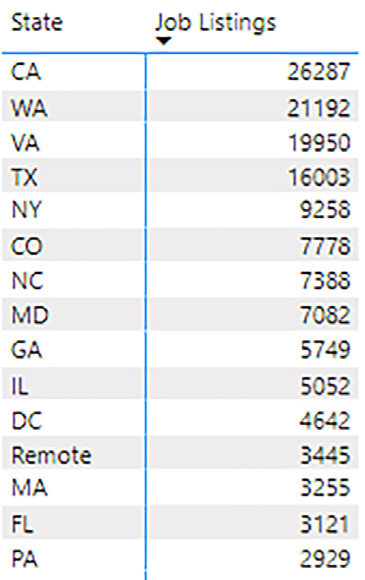
Within the United States, 85% of the relevant tech company job listings are found in the top 15 states (including one category for listings only marked as “remote”), with 50% found in California, Washington, Virginia and Texas.
4. WHAT ARE TECH COMPANIES HIRING?
The most critical question in any analysis like this is to spec ify what are the most commonly
requested job roles and skills. The simplest way to do this wou ld be by job title provided in the listings
themselves. This methodology for the top 10 job titles for both the US and India are shown below.
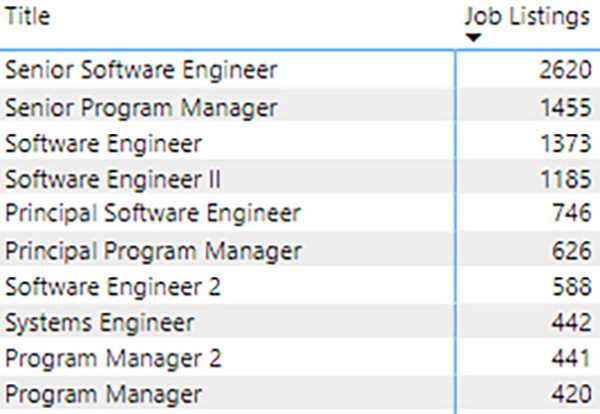
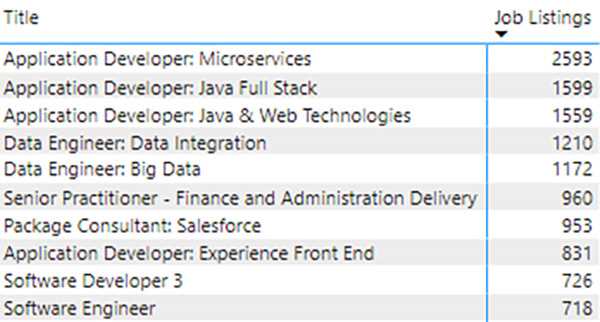
However, even with the limited scope to 10 titles these tables showcase a problem with this methodology; with many different companies, locations, and job l istings, there are limitless possible permutations of job titles. This makes it impossible to get a true assessment of the types of roles and skills being hired. To solve this, we must place the titles into a standardized job framework.
JOB FRAMEWORK ANALYSIS
In a proper job framework, job titles are standardized, then categorized together with other jobs of similar duties into a smaller number of job families, which are in turn categorized into workforce categories. In this analysis 413252 job postings in 2021 had 15 5,057 unique job titles, which is very unwieldy for analysis. Utilizing HCMI’s job framework database and a score matching methodology6, This was categorized into 167 job families in 11 workforce categories.
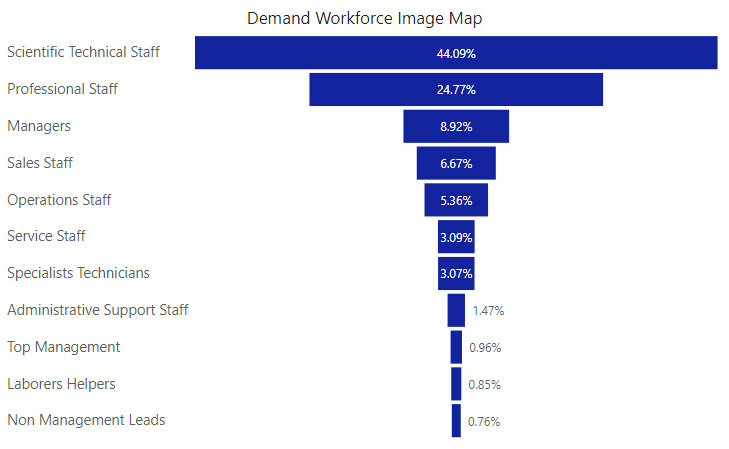
Analyzing this by different locations can provide additional ins ight. Figures 5 and 6 below show that
both USA and India tech industry job listings prioritize Scient ific and Technical Staff, but India’s
emphasis is heavier, with almost 64% of such jobs fitting that category (e.g. Developers & Engineers).
The USA tech industry, however, includes a more prominent mix of other categories such as
Professional staff (e.g. business analysts) and Sales Reps.
Most jobs in the Scientific Technical category require university bachelor and post-secondary graduate degrees in multiple areas within STEM (Science, Technology, Engineering, Math), and may also require some form of professional certification. Because of this, these types of jobs are often particularly difficult to fill, and often command a more competitive compensation than most workforce categories aside from certain management and leadership roles. Knowledge of the type of jobs being hired by competitors and the challenges of acquiring that talent inform companies of what kind of talent war to prepare for and how many resources may be needed for it.
Any of these workforce categories could be broken down into their job families and titles for deeper analysis. As an example of this kind of deep dive, we’ll look at the most prominent job family in listings, Software Developers.
SOFTWARE DEVELOPER ANALYSIS
In 2021, the 41 tech companies put up 116966 postings requestin g, 41782 of which were found in the USA, and of which 80% are found in the following 10 states: Washington, California, Virginia, Texas, Colorado, North Carolina, Maryland, New York, Georgia, and Massachusetts.
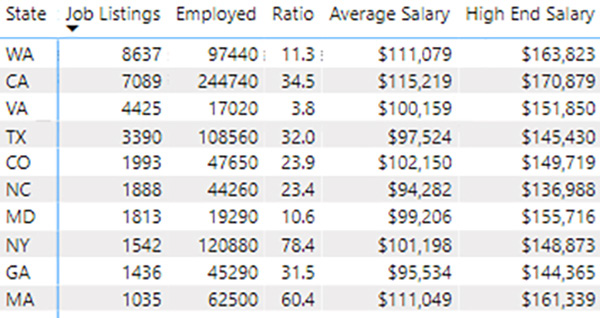
In Table 4, we provide some additional data from the Bureau of Labor Statistics occupation labor set.8 While government sources lack the detail of demand data provided by Thinknum, BLS has very useful data on labor supply, that is, people currently emp loyed in different job roles, as well as average salary.
By connecting the two data sources, we can better evaluate the state of competition for talent within the tech industry. In Table 4 below we show Job listings for software developers next to the total employed in the type of role.9 Next to that we provide a simple ratio (Employed/Job Listings) as a measure of how tight the competition is for that kind of talent in the area. Finally, we list the average salary and upper end salary (90th percentile) for Software Developers to compare costs.
We can take this information together to assess each state. New York competitors should find it easier to fill these kinds of roles; Salary falls in the midrange of these 10 states, and the total software developers employed is both very plentiful (2nd place) and largely outweighs job listings.
Washington State, on the other hand, is a tighter market for software developer talent. The ratio of working software developers to job postings ranks 8th among these 10 states, and the average cost per employee is the 2nd highest.
This assessment can be further illustrated as shown in Figures 7 and 8. In the first, Total Supply is
compared to Tech industry demand; the further to the right and lower a state is the more plentiful
supply is in comparison to the demand, and therefore the easier time similar tech companies would
expect to fill positions therein.
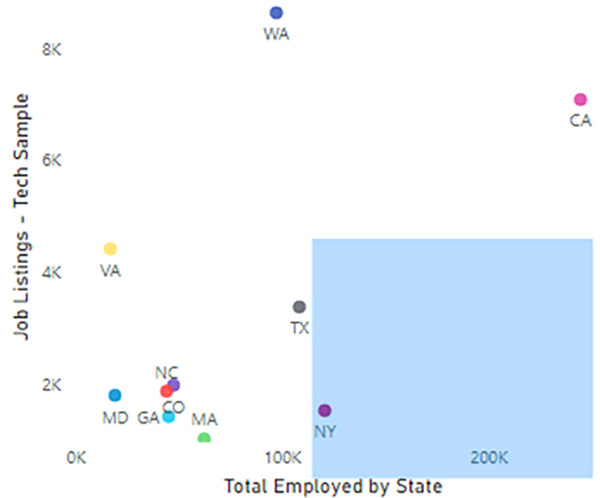
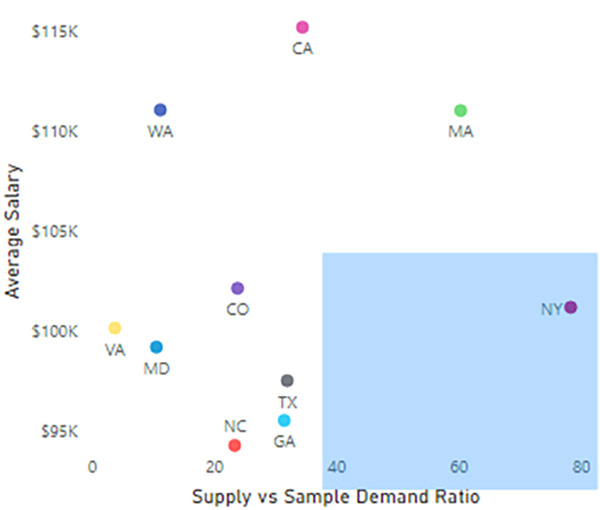
Figure 8 takes this analysis a step further – by comparing the supply demand ratio metric to average salary, we can assess both where supply is more readily available (further to the right) and where average costs are lower (further down). For both charts, the “blue” zone provided is considered the ideal.
For companies seeking to compete for top talent, a full analysis comparing all relevant locations on these measures can help highlight where talent is the most optimal combination of cost effective and plentiful. With the surge in relevance of remote work, this type of data has become even more necessary to both identify where to get talent, and what to offer to bring in the best.
5. CONCLUSION
This paper provides just a taste of the type of analysis that can be done with demand data as plentiful as it is in Thinknum’s database. We showed that some of the top tech companies in the world are greatly expanding their hiring in the USA and internationally, that India in particular is experiencing a boom in demand, and what kind of roles are being requested. We then showed the power of putting job listing data into a job framework, allowing for better categorization and comparison with BLS data on salary and supply, along with a deep dive into the software developer job family comparing tech industry demand in comparison to available talent.
So much of a company’s value lies in its people and their skill sets. More and more what differentiates the companies that thrive in changing economic times are their ability to consistently attract and retain top talent. And competitive intelligence data remains one of the most powerful tools to help companies do just that.